Sample Patent Map
The on-line patent maps are interactive: clicking on the area of the patent map takes a user to the details of the patents.
In a typical patent mapping project we work with the client team to transform a thorough understanding of the client’s marketing and technical plans into a set of bespoke categories (multiple taxonomies) for classifying patents.
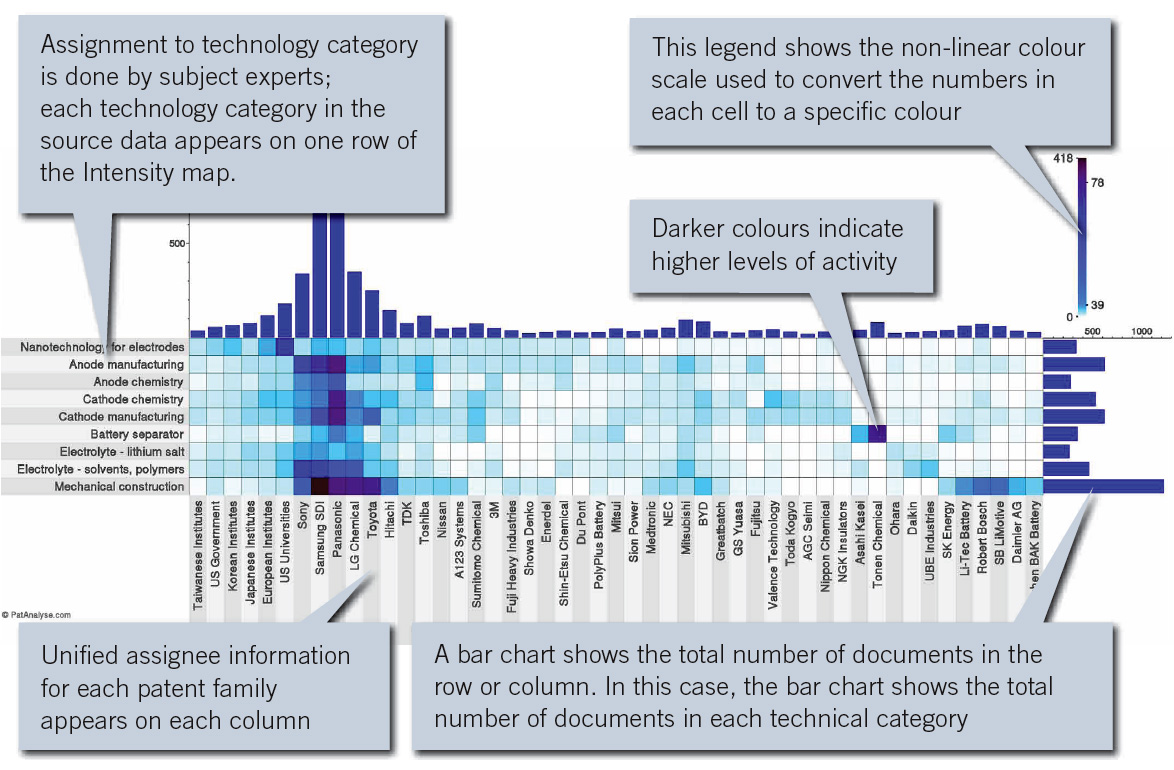
The patent map shown below shows the top assignees on the X-axis vs technical categories on the Y-axis for generic lithium-ion batteries technologies. The bar charts on the top and on the right represent a conventional aggregation of data with the bar chart numbers equal to the number of patents assigned to each individual assignee or technical category. The two-dimensional ‘intensity map’ shows the numbers in each cell of the table according to the colour code shown in the legend.
The on-line patent maps are interactive - clicking either on an individual square of the intensity map or the bar chart itself takes the user to the list of patents, representing simple patent families. Clicking on the individual patent record shows bibliographic details of the individual patent family including the claims of all patents in the family, the legal status of patent documents, priority information, and a front-page picture.
|